12 Product-Led Growth Metrics to Measure Success
In today’s crowded SaaS market, simply having a great product isn’t enough. To beat the competition, you need a go-to-market strategy that transforms your product into a growth engine. This is product-led growth (PLG), which leverages your product to attract, convert, and retain users and create organizational alignment across teams.
With 91% of B2B SaaS companies investing more in this approach, it’s crucial to know if your startup’s PLG strategy is actually driving revenue and scaling your business. How do you gain this insight?
The answer lies in carefully tracking product-led growth metrics to unlock the transformative power of product-led growth, guide your strategy, and measure your success.
Understanding Product-led Growth Strategy
In product-led growth, your product is the primary driver of customer acquisition, conversion, and expansion. Unlike traditional sales-driven models, PLG lets your product do the talking. This strategy is ideal for SaaS companies offering intuitive, easy-to-use solutions—particularly those with freemium or free trial options.
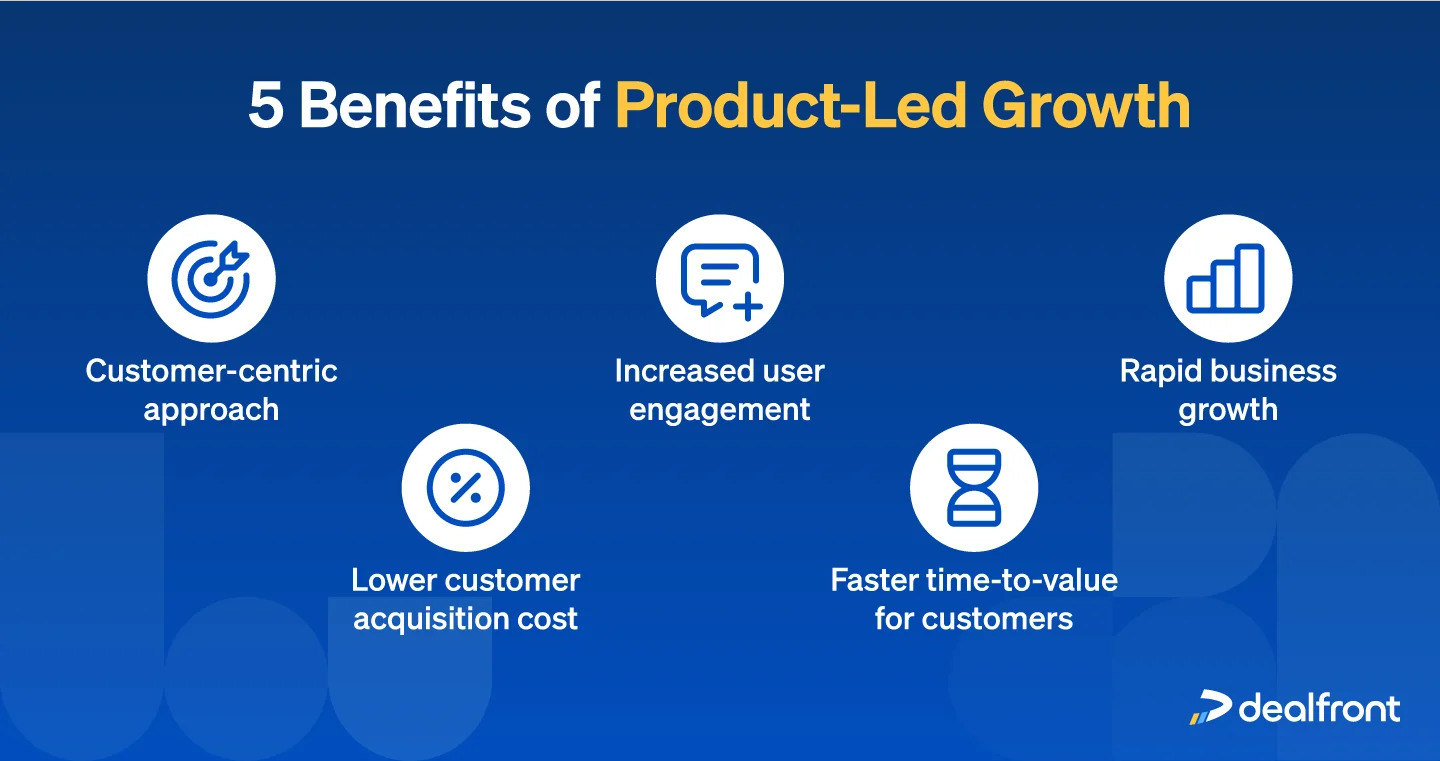
Why is PLG so important? It can significantly lower customer acquisition costs, increase adoption rates, and create a more user-centric business model.
The PLG Flywheel and its Stages
Picture this as the product-led growth flywheel: happy users who experience the value of your product first-hand are more likely to upgrade, expand their usage, and become advocates, fueling further growth and attracting new customers organically.
The PLG flywheel typically comprises these stages:
- Evaluate: Potential customers discover your product.
- Activate: Users experience the product’s core value for the first time.
- Adopt: Users integrate the product into their regular workflows.
- Expand: Users upgrade, increase usage, or purchase add-ons.
- Advocate: Satisfied users recommend your product, driving new growth.
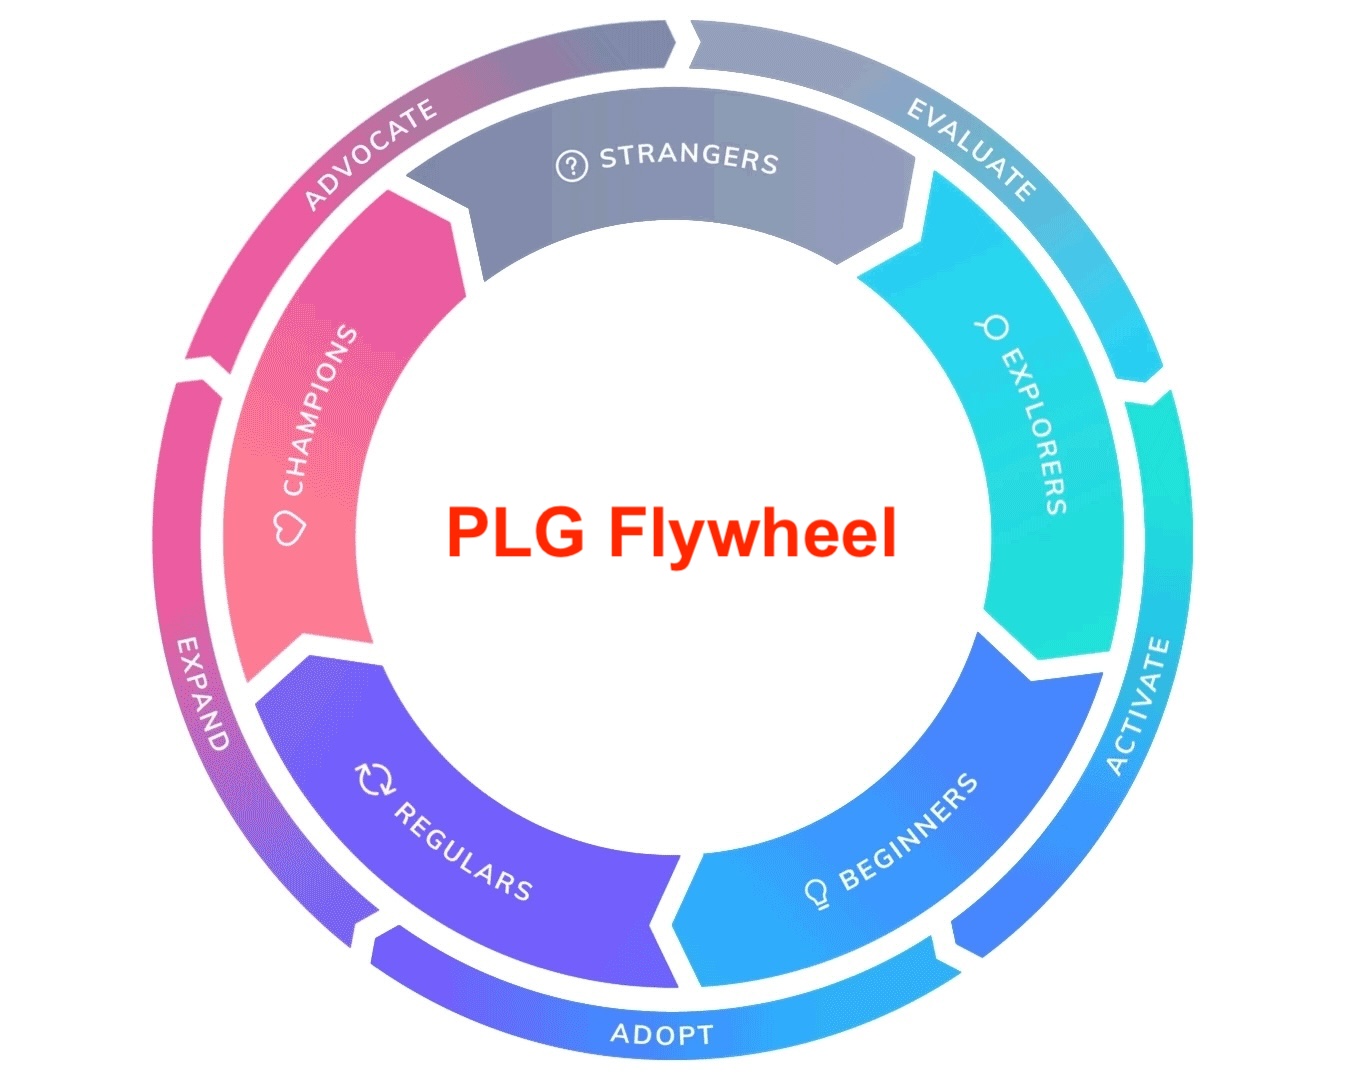
The PLG flywheel places the product as the centerpiece, leading to a self-perpetuating cycle of customer acquisition, retention, and expansion.
What are product-led growth metrics, exactly?
Product-led growth metrics are the data ‘fuel’ that keeps the PLG flywheel spinning.
These metrics are specific data points that reveal how users interact with your product and their progress along the customer journey. They track critical actions like signing up, completing onboarding, using features, upgrading to paid plans, and referring others. Unlike traditional business metrics focused on sales and marketing, PLG metrics spotlight the product itself.
Think of PLG metrics as health indicators for your product and growth strategy. They show you:
- Product Adoption: How quickly and easily are users finding value in your product?
- Conversion Rates: Are you effectively converting free users into paying customers?
- Feature Usage: Which features are most popular, and which ones need improvement?
- User Advocacy: Are customers becoming passionate promoters of your product?
By monitoring these crucial metrics, you’ll gain a more comprehensive understanding of the strengths and weaknesses in your PLG approach.
Why You Need to Track the Right PLG Success Metrics
Imagine pouring your resources into crafting a seamless product-led experience designed to convert users into loyal customers. However, you won’t know if your efforts are paying off without tracking the right metrics. Selecting the wrong metrics can lead to poor investments and missed opportunities.
Here’s why carefully measuring the right PLG metrics is essential for your business:
Drives Data-driven Decisions
Metrics provide concrete evidence of user behavior, product adoption, and key conversion points. This data empowers you to make informed decisions that refine your PLG strategy and propel growth.
Identifies Bottlenecks
Analyzing PLG success metrics uncovers the roadblocks hindering user progress and conversions. For example, a high free-user churn rate might indicate a troublesome onboarding process, while a low upgrade rate could highlight pricing misalignment. Metrics bring clarity to where your product or process needs improvement.
Focus on What Matters
With a data-driven approach, you’ll be able to prioritize features and functionalities that align with what truly drives growth. Then, you can ditch the guesswork and build your roadmap based on real-world results.
Unlock Growth Potential
Tracking the right PLG metrics empowers you to unlock the full potential of your product-led growth strategy. Data-driven decisions help you consistently optimize the product experience, leading to greater user satisfaction, higher conversions, and sustainable success.
12 Product-Led Growth Metrics to Measure Success
Here are a dozen critical PLG success metrics to monitor, ordered by stages in the PLG flywheel. It’s important to note that the flywheel is an iterative model, so some metrics could appear in multiple stages.
Evaluate
1. Conversion Rate from Page Views to Signups
What it is: The percentage of website visitors who become signups (free trials or freemium users).
How it’s measured: (Signups / Total Page Views) x 100
Measures success by: Revealing how well your website messaging and value proposition resonate with your target audience.
Example: A low conversion rate could indicate unclear value statements, poor targeting, or a mismatch between what’s promised on the website and what the user experiences when they sign up.
Activate
2. Active Users
What it is: Users who engage with your product regularly, demonstrating a commitment to the value it provides. The exact definition of ‘active’ varies based on your product and business model.
How it’s measured: Depending on your specific definition, measurement could involve tracking login frequency, feature usage, or specific actions that indicate value realization.
Measures success by: Demonstrating how many users consistently return for value. High active user counts indicate product stickiness and healthy adoption.
Example: For a project management SaaS, an ‘active user’ might be one who creates multiple projects, adds tasks and collaborators, and logs in several times a week. Tracking this metric reveals if users are deriving ongoing value from your solution.
3. Completed Onboarding to Active User
What it is: The percentage of users who successfully complete onboarding and go on to become active users.
How it’s measured: (Active Users / Users Who Complete Onboarding) x 100
Measures success by: Your ability to turn new users into committed, engaged ones
Example: A low conversion rate here could mean the initial ‘aha!’ moment doesn’t translate into lasting value, or that it might be difficult to discover and use advanced features post-onboarding.
Adopt
4. Free Trial Conversion Rate
What it is: The percentage of free trial users who convert to paying customers.
How it’s measured: (Paying Customers Post-Trial / Total Free Trial Users) x 100
Measures success by: Demonstrating how well your product convinces users to commit financially. A low rate could signify ineffective pricing, a mismatch between the initial experience and the paid version, or friction points in the upgrade process.
Example: If 100 people start a free trial and 20 become paying customers, your free trial conversion rate is 20%. This is a crucial metric for PLG because it showcases your product’s ability to deliver value and convince users of its worth.
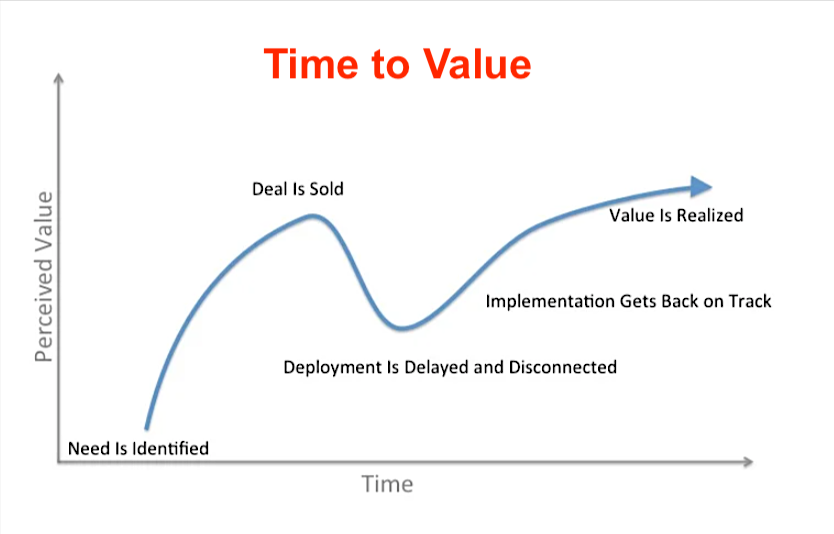
5. Time to Value (TTV)
What it is: How long it takes new users to realize your product’s value. The goal should be to reduce time to value as much as possible—the sooner users reach their first ‘aha!’ moment or activation event, the better.
How it’s measured: This may vary depending on your product, but it could be the time between signup and completing key actions demonstrating value realization (e.g., creating their first project in a project management tool, sending their first campaign in an email marketing tool, etc.).
Measures success by: Indicating how quickly users experience your product’s core value. A short TTV correlates to higher activation, conversion, and retention rates. Optimizing your onboarding and in-app guidance can significantly reduce TTV.
Example: If it takes an average of 2 days for a new user of a design tool to create and share their first design, that’s their TTV. Monitoring and streamlining this process is essential for improving user experience.
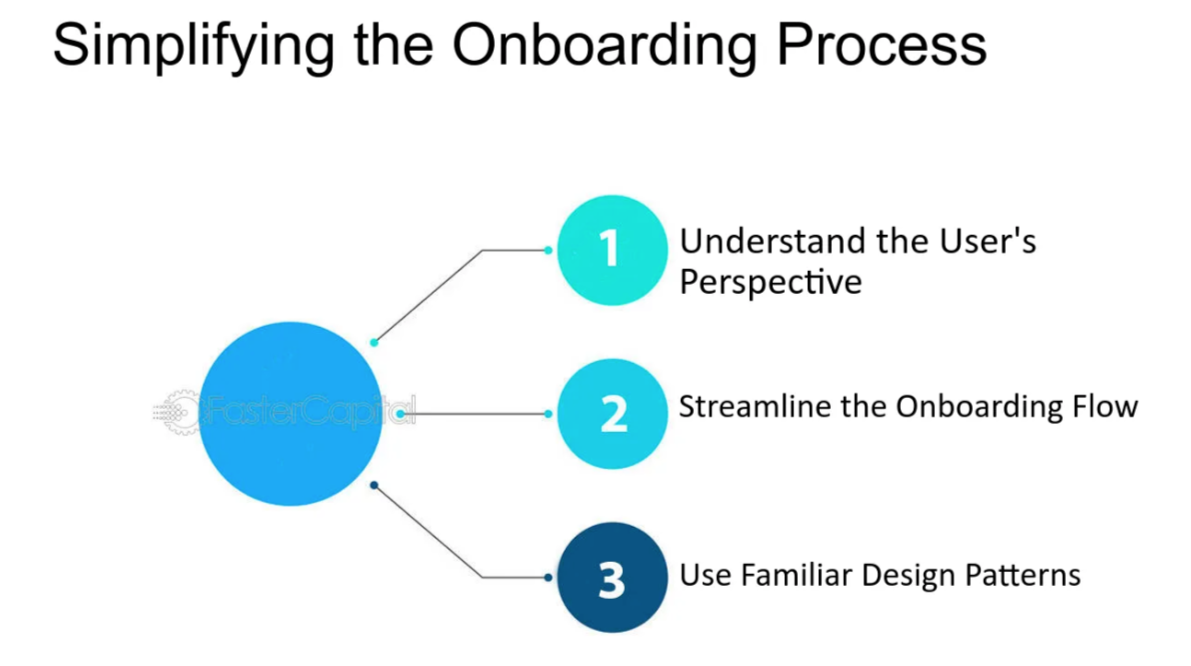
6. Signups to Completed Onboarding
What it is: The percentage of new sign-ups who successfully finish the onboarding process and reach your product’s “aha!” moment—the point where they first experience its core value.
How it’s measured: (Users Who Complete Onboarding / Total Signups) x 100
Measures success by: Indicating the effectiveness of your onboarding flow.
Example: A low rate might signal friction points, confusing instructions, or a disconnect between the initial promises made and the product experience. Optimizing your onboarding can significantly improve user activation.
Expand
7. Expansion MRR
What it is: The additional monthly recurring revenue (MRR) generated from existing customers through upgrades, add-ons, or purchasing more seats.
How it’s measured: (New MRR from Existing Customers – Churned MRR from Existing Customers) / Previous Month’s MRR from Existing Customers) x 100
Measures success by: Demonstrating your ability to grow revenue within your existing customer base. A high expansion MRR shows that customers find increasing value in your product and are willing to pay more, a key element of successful PLG models.
Example: If a customer upgrades from the basic plan ($50/month) to the premium plan ($150/month), this represents $100 of expansion MRR.
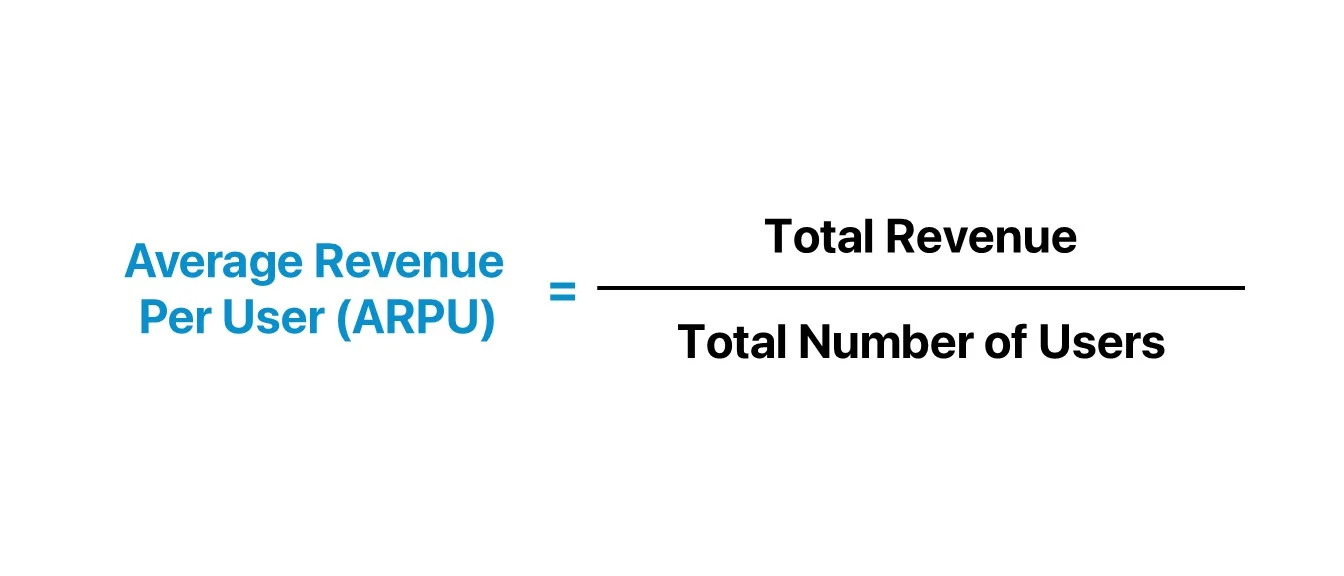
8. Average Revenue Per User (ARPU)
What it is: The average amount of revenue you generate per user over a specific period (usually monthly or annually).
How it’s measured: Total MRR / Total Number of Users
Measures success by: ARPU gives a high-level view of your business’s financial health and indicates your pricing model’s effectiveness. Tracking ARPU over time reveals how well you’re monetizing your user base.
Example: If your total MRR is $50,000 with 1,000 customers, your ARPU is $50. ARPU growth could be driven by users upgrading to higher tiers or purchasing add-ons.
Advocate
9 & 10. Daily Active Users (DAU) and Monthly Active Users (MAU)
What it is: DAU tracks users who engage with your product within a 24-hour period, while MAU measures engagement over a month.
How it’s measured: The number of unique users actively engaging with your product within the chosen timeframe.
Measures success by: Revealing product stickiness and user engagement patterns over time. A high DAU/MAU ratio indicates strong daily usage, which is vital for many PLG companies. Engaged users daily and monthly become more likely product advocates. However, this metric may also be placed in another stage, depending on your product and business model.
Example: A productivity app that sees a high DAU but a low MAU might need to focus on features that increase long-term retention and encourage users to return beyond their immediate tasks.
Metrics Spanning Stages
11. Customer Acquisition Cost (CAC)
What it is: The average cost of acquiring a paying customer.
How it’s measured: Total Sales & Marketing Expenses / Number of New Paying Customers
Measures success by: Determining the efficiency of your customer acquisition efforts. Relevant across all stages, CAC impacts your growth potential. A low CAC is crucial in PLG models, and any substantial change (up or down) needs to be investigated to understand what’s driving it.
Example: If you spend $1,000 on marketing and acquire 10 customers, your CAC is $100. Monitoring changes in CAC helps evaluate the efficiency of your marketing and sales efforts, especially when paired with your CLV.
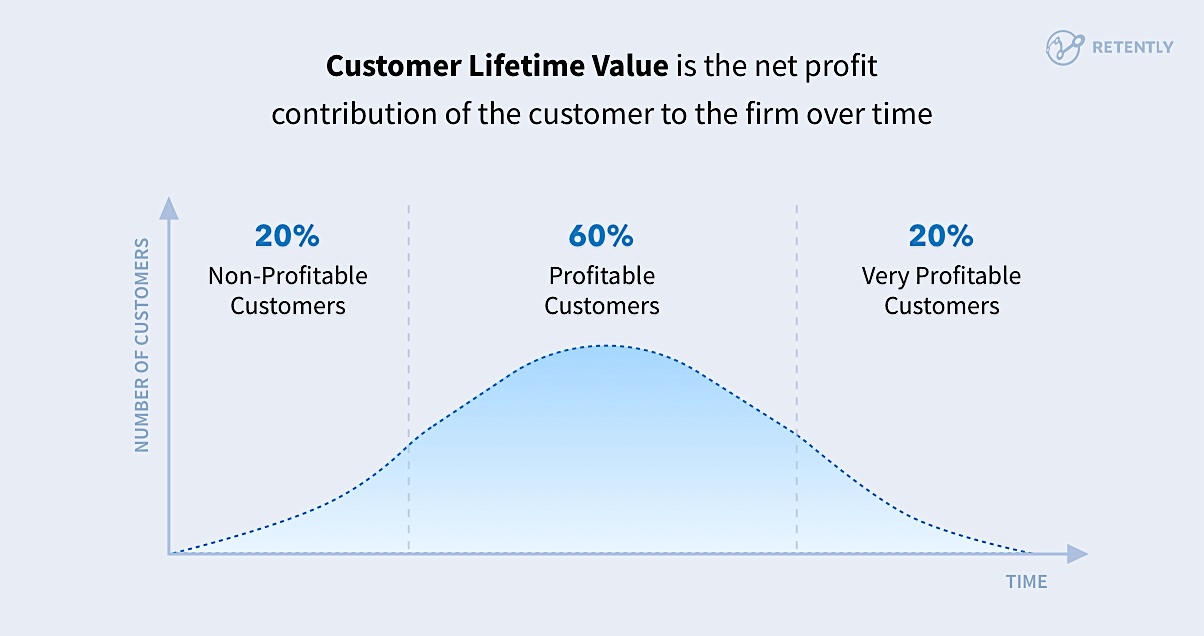
12. Customer Lifetime Value (CLV)
What it is: A long-term metric influenced by every flywheel stage, Customer Lifetime Value is the total revenue a customer generates over their relationship with your SaaS product.
How it’s measured: Average Revenue Per User (ARPU) x Average Customer Lifespan
Measures success by: Evaluating a customer’s long-term worth. A high CLV means your product delivers continued value and drives sustainable growth.
Example: If your average customer pays $50/month and remains a customer for two years, their LTV is $1,200. A high CLV justifies spending more on CAC and highlights the importance of features contributing to long-term retention.
Unlock the Power of Product-Led Growth with mvpGrow
Following a product-led growth strategy offers many benefits for SaaS startups. Tracking the right metrics gives you the roadmap to understand your users, optimize their experience, drive growth, and measure your success. However, implementing PLG requires more than just following the data. It requires marketing expertise and industry savvy to stand out and break away from the pack.
That’s where mvpGrow excels. As a specialized marketing agency with deep experience in SaaS and PLG, we’ll work with your startup to analyze your metrics, identify growth opportunities, and launch tailored marketing campaigns that attract, activate, and retain users.
Ready to transform your product into a growth engine? Book a free strategy call today to discover how mvpGrow helps you achieve scalable, sustainable success.
Turn insights into pipeline.
Book a strategy call and we'll map your GTM gaps in 30 minutes.
Book a time